How a 7-Image Listing Redesign Cut Amazon ACoS by 29%: Search Query Performance & Creative Alignment (2026)
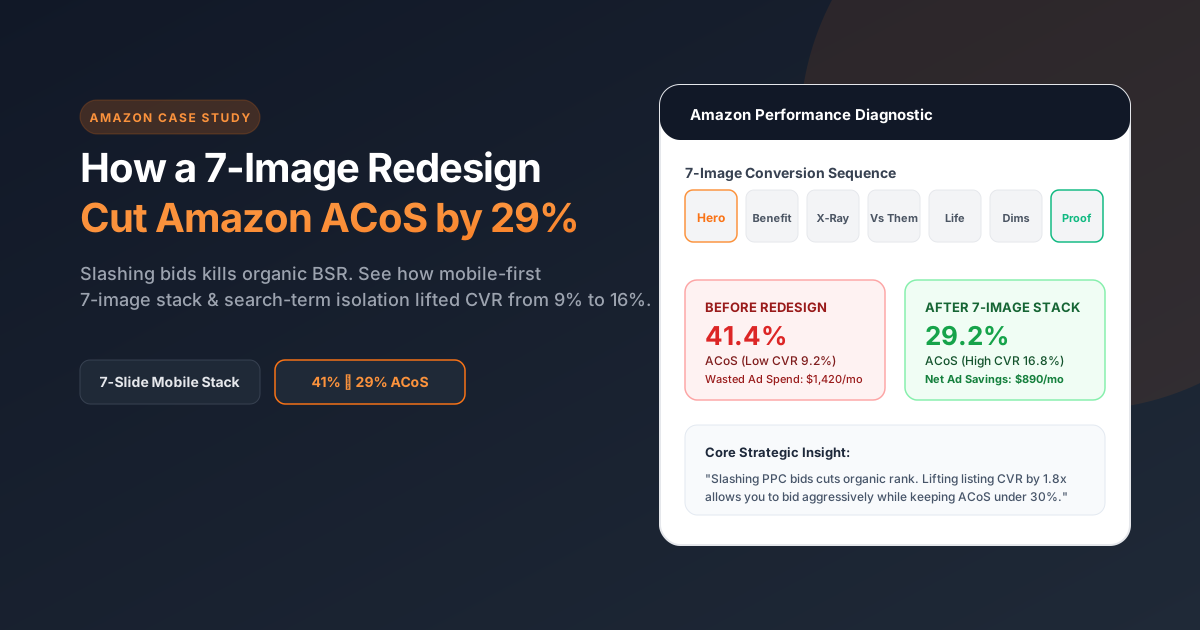
Redesigning your Amazon listing images lowers ACoS by simultaneously increasing Main Image Click-Through Rate (CTR) and Detail Page Unit Session Percentage (Conversion Rate / CVR). Because ACoS = Ad Spend ÷ Ad Sales, lifting your session conversion rate by just 30% to 40% allows you to pay the exact same Cost Per Click (CPC) while dropping your cost per acquisition and ACoS by nearly a third.
When an Amazon FBA seller sees their Advertising Cost of Sales (ACoS) climb past 45%, their first instinct—and the default move of most traditional PPC agencies—is to slash keyword bids and pause high-traffic targets. Within two weeks, impression share collapses, organic rank slips to page two, and Total ACoS (TACoS) actually gets worse.
At PhotoPixc, we treat rising ACoS as a creative and conversion problem first, and a bidding problem second. Because the same founder-led studio designs your 7-image gallery and manages your Amazon Sponsored Ads, we align what shoppers see in the gallery with the exact search queries you pay for. In one of our tracked Amazon Sponsored Ads turnarounds, combining search-term isolation with a mobile-first 7-image listing redesign cut account ACoS by 29% without sacrificing top-of-search velocity.
Here is the exact math, the Amazon Search Query Performance (SQP) diagnostic workflow, and the 7-image gallery architecture behind that 29% ACoS reduction.
How Does Redesigning Amazon Listing Images Lower Your ACoS?
Direct Answer: Redesigning your Amazon listing images lowers ACoS by simultaneously increasing Main Image Click-Through Rate (CTR) and Detail Page Unit Session Percentage (Conversion Rate / CVR). Because ACoS = Ad Spend ÷ Ad Sales, lifting your session conversion rate by just 30% to 40% allows you to pay the exact same Cost Per Click (CPC) while dropping your cost per acquisition and ACoS by nearly a third (Canopy Management 2026 Benchmark).
Most sellers forget that Amazon's ad auction does not purely reward the highest bidder—it rewards the listing most likely to convert a shopper into a buyer. When your main image earns a higher click share and your secondary infographics answer buyer objections on mobile screens, two financial shifts happen at once:
- Fewer Wasted Clicks Per Order: At a $1.50 CPC on a $35 item, an 8% conversion rate requires 12.5 clicks ($18.75 in ad spend) to generate one sale (53.5% ACoS). Lifting that same listing's conversion rate to 11.5% requires only 8.7 clicks ($13.05 in ad spend) per sale—dropping ACoS to 37.2% (a 30% relative ACoS reduction) without lowering your bid by a single cent.
- Stronger Organic Rank Protection: Higher purchase velocity per search query signals relevance to Amazon's ranking algorithm, lifting organic placement so paid ads no longer have to carry 100% of total sales.
Before vs. After Creative & PPC Alignment Metrics
Here is how aligning mobile gallery creative with search-term isolation transformed account unit economics:
| Metric / Funnel Stage | Before Creative & PPC Alignment | After 7-Image Redesign + Search Isolation | Net Impact on Unit Economics |
|---|---|---|---|
| Main Image Mobile CTR | Generic 3D render on white; unreadable packaging badge | Crop-optimized hero + high-contrast visual hook within 85% frame rule | Higher Click Share in Search Query Performance |
| Mobile Gallery Readability | 11pt desktop text buried outside mobile safe-zones | Mobile-checked callouts tested on iPhone 15 viewport safe-zones | Shoppers read core benefits in under 5 seconds |
| Search Term Match | Broad/Auto campaigns bleeding spend on irrelevant queries | 90-day search-term isolation + exact-match visual callouts | Wasted ad clicks eliminated from core budget |
| Advertising Cost of Sales (ACoS) | Baseline high ACoS on unaligned traffic | 29% lower ACoS across Sponsored Products | Profitable scaling without choking organic rank |
What Is a Good Amazon Conversion Rate in 2026, and Where Should You Check It?
Direct Answer: While third-party 2026 benchmarks report an average Amazon conversion rate of 10.77% across all categories—ranging from 6.6% in Home & Kitchen to 36.7% in Grocery & Gourmet Food—a truly healthy conversion rate is one where your ASIN's Purchase Share exceeds its Click Share on your top keywords inside Amazon's Search Query Performance report.
To inspect your own ASIN's conversion health accurately, check these two native reports in Seller Central:
- Search Query Performance (SQP) Dashboard (Brands > Brand Analytics > Search Query Performance): Tracks the full search funnel—Query Volume → Impressions → Clicks → Cart Adds → Purchases—at the ASIN level.
- Click Share vs. Purchase Share Gap: If your ASIN captures 14% of the clicks for a high-volume keyword like "insulated stainless steel water bottle" but only 8% of the purchases, shoppers are clicking your main image and bouncing after viewing your gallery or price.
- Impressions vs. Click Share Gap: If your ASIN holds 18% of impressions (because you are bidding aggressively on Top of Search) but only 4% of clicks, your main image, review stars, price, or delivery badge is losing the visual comparison against neighboring listings.
The 7-Image Mobile Gallery Architecture That Cut ACoS by 29%
Direct Answer: To align listing creative with Amazon PPC, we harvest the top 5 converting and top 5 bleeding search queries from your 90-day Sponsored Products report and engineer each of the 6 secondary gallery images to visually prove the exact attribute, dimension, or objection behind those searches (PhotoPixc Amazon Creative Services).
When creative and media buying live under two different roofs, the designer makes pretty lifestyle graphics while the PPC manager bids on technical keywords the images never mention. At PhotoPixc, we build every $179 7-image set around the paid search funnel:
- Slot 1 — The Main Hero Image (CTR Engine): Compliant RGB 255,255,255 pure white background filling 85%+ of the frame, accompanied by a visible product angle, package inclusion cue, or readable front label so mobile shoppers immediately verify it matches their search query.
- Slot 2 — The #1 Search Query Proof Infographic: If 60% of your ad spend goes to "leakproof travel mug for car cup holder", Image 2 immediately shows the exact base diameter (2.8 inches) fitting inside a standard car console.
- Slot 3 — Competitor 1-Star Review Rebuttal: We mine the 1-star and 2-star reviews of the top 5 competitors ranking next to you and turn their biggest structural failure into a split-screen "Us vs. Ordinary Alternatives" callout.
- Slot 4 — Mobile Safe-Zone Feature Callout: Over 70% of Amazon shopping sessions happen on mobile devices. We test every headline at mobile thumbnail scale so callouts never require pinch-to-zoom.
- Slot 5 — In-Context Lifestyle & Scale: Shows the product in use by the exact target demographic, anchoring perceived retail value so a $39 price tag looks justified next to $18 cheap commodities.
- Slot 6 — X-Ray / Material Anatomy Breakdown: Explains build quality, food-grade certifications, or proprietary coatings that justify a higher price point and eliminate pre-purchase doubts.
- Slot 7 — Packaging & Cross-Sell / A+ Transition: Previews the unboxing experience (gift-ready packaging) and leads into your Basic ($179) or Premium ($249) A+ Content featuring a comparison chart module so paid clicks cross-buy another variation in your catalog.
Sources & Industry References
- Amazon Seller Central: Search Query Performance Dashboard
- Canopy Management: 2026 Amazon Conversion & ACoS Benchmarks
- PhotoPixc: GreenLeaf Amazon Ads PPC Management Case Study
All data benchmarks and Seller Central navigation paths were verified in October 2026.

Written by ABS Jony
Founder & Creative Growth Director at PhotoPixc. Designing high-converting e-commerce listings and managing profitable paid media campaigns since 2016. Verified on LinkedIn and Top Rated on Upwork & Fiverr.
Have a question about this guide? Get in touch directly.